Anatomy of a Narrow Equity Market
Author: Abhishek Ashok
June 26, 2023
The narrowing of U.S. equity performance has been a hot topic of discussion so far this year, but what does it mean for investors when a small handful of stocks makes up such a huge percentage of the market’s overall returns?
Here below are three key statistics that help explain the extreme nature of this phenomenon and where opportunities and risks may lie in the future as markets eventually normalize over time.
All Things Not Being Equal
One of our favourite ways to gauge the effect that narrower market leadership can have on investors is to compare the performance of the S&P 500 Index – which is weighted by market capitalization – against the S&P 500 Equal Weight Index. The handful of large cap stocks outperforming the broader market so dramatically in recent months have a much larger weight representation in the former than they do in the latter, which, in turn, means their gains make up a greater percentage of the S&P 500 Index’s overall gains than they do for its equal-weighted counterpart.
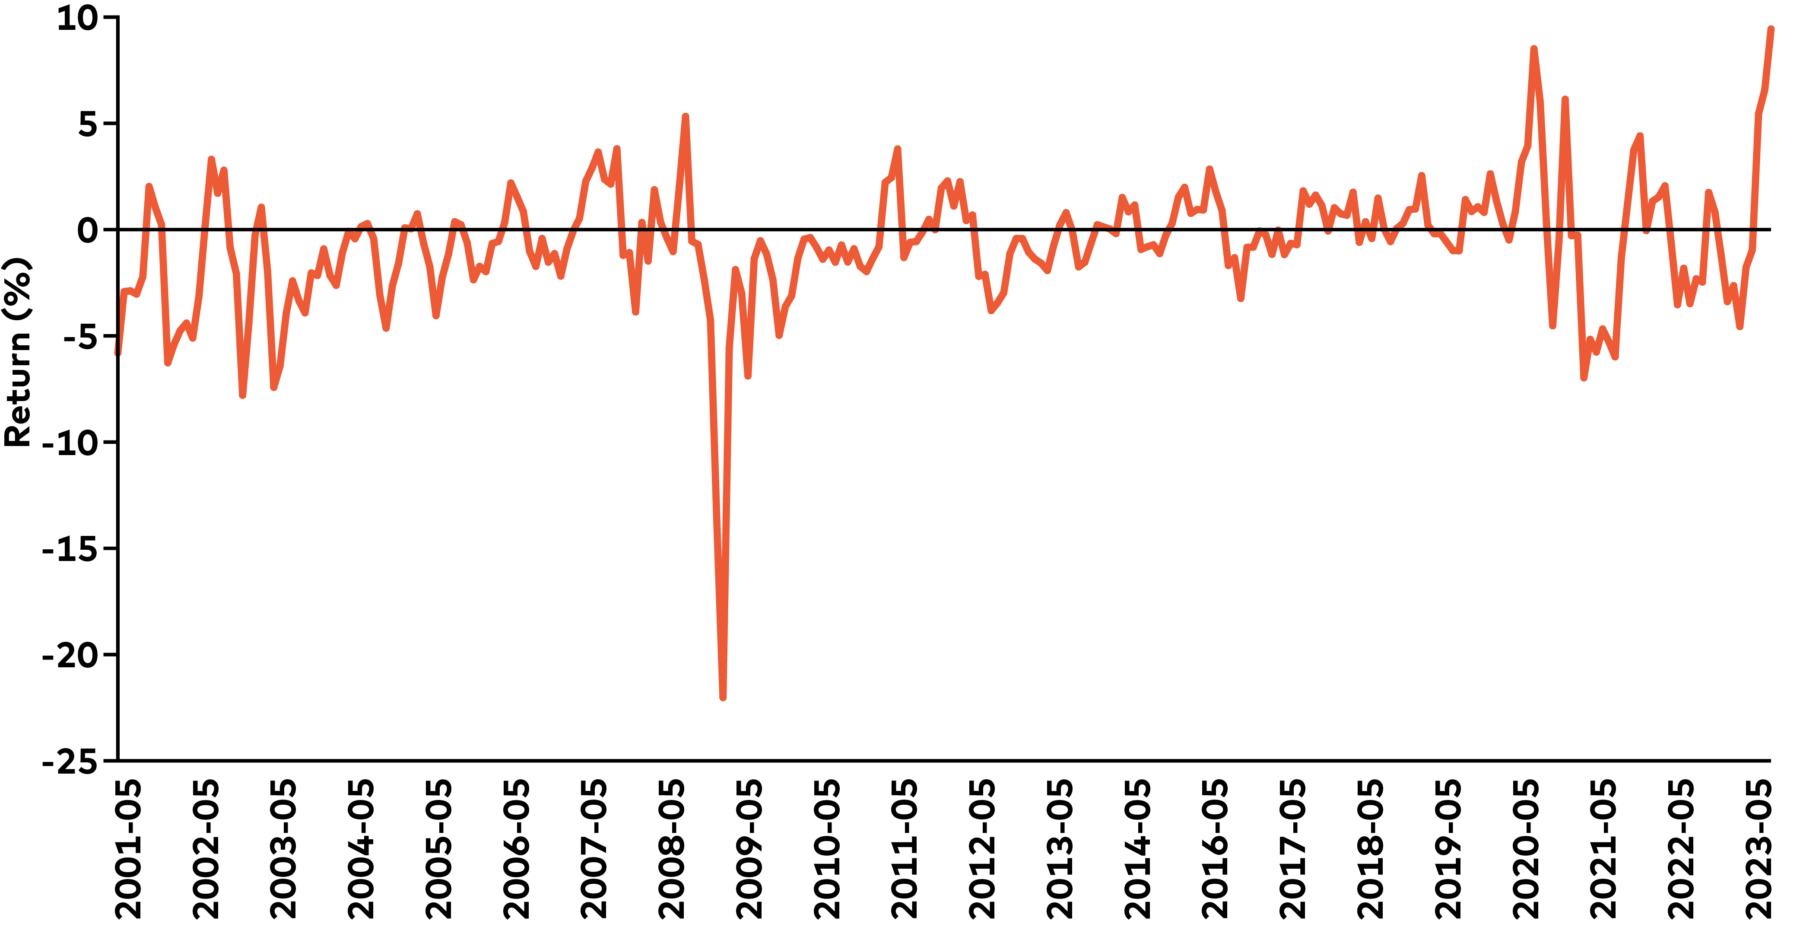
Moreover, the better these large caps perform in relation to the rest of the S&P cap-weighted index, the greater their weighting becomes, leading to an even greater disparity of returns versus the equal-weighted index. Indeed, as the chart below shows, the positive spread between the two indexes was larger at the end of May than it’s been at any time so far this century.
Performance Spread between the S&P 500 Index and the S&P Equal Weight Index

Source: AGF Investments using data from Factset as of June 16, 2023. Performance spread between the three month rolling return of the S&P 500 Index and the S&P 500 Equal Weighted Index. Past performance is not indicative of future results. One cannot invest directly in an Index.
Size Matters. But sector matters more.
There’s little doubt that market leadership has narrowed as the result of a select few large cap stocks vastly outperforming the broader market, but it seems the phenomenon is being driven more by sector preferences than it is by size.
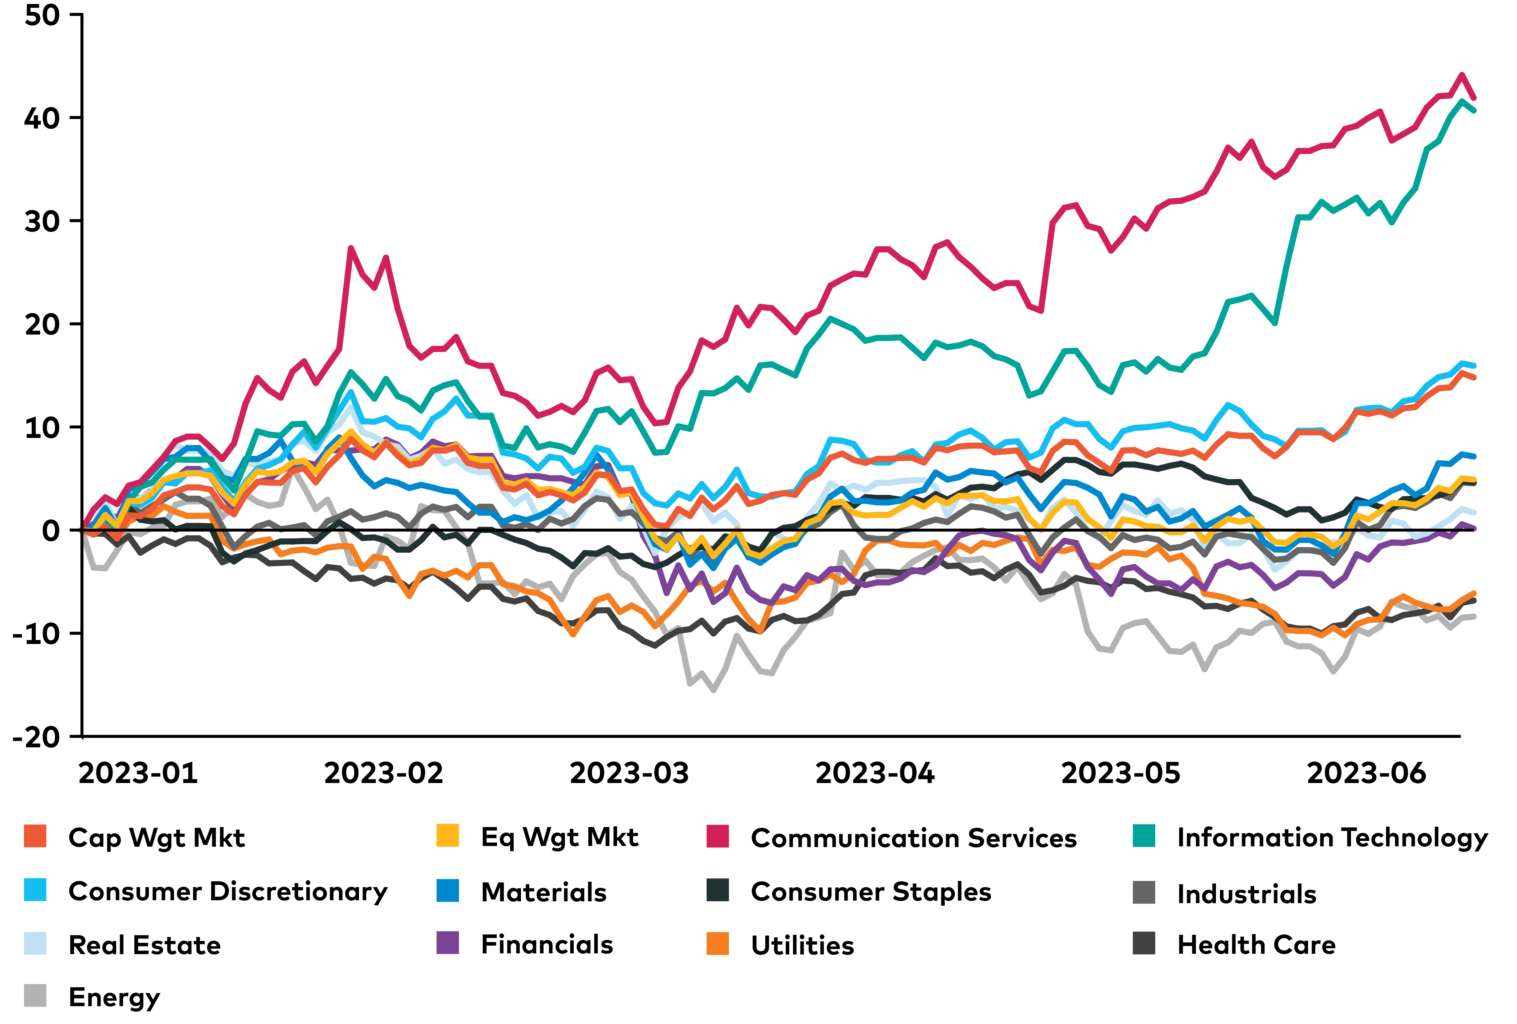
While the largest names in the Communications Services and Information Technology sectors have vastly outperformed the S&P 500 and the S&P 500 Equal Weight Index, that isn’t the case in other sectors. In fact, large caps have underperformed the cap-weighted index in eight of the 11 sectors analyzed, and underperformed the equal-weighted index in four sectors (see chart below).
Performance of Largest-Capitalization Stocks within Each Sector

Source: AGF Investments using data from Factset as of June 16, 2023. Performance shown is based on the historical returns of the constituents of the S&P 500 Index broken out by the largest stocks by market capitalization within each sector as well as the historical returns of the S&P 500 Index and the S&P 500 Equal Weighted Index. Investors are not able to invest directly in an index and as such the chart is not meant to show returns or performance an investor would have experienced, but to demonstrate the variation in performance by sector within each index. Past performance is not indicative of future results. One cannot invest directly in an index.
Ready for a Reversal?
The disparity in U.S. equity performance that is evident across differently weighted equity indexes and across different sectors can also be seen at the industry level. In particular, gains in semiconductors and semiconductor equipment stocks averaged 23.49 over the three-month period ending May 31, 2023, which represents a standard deviation of 2.87. As a reminder, standard deviation measures the variance from the mean average of a number or data set as calculated over a set period of time. In this case, it represents the difference in return from what the semiconductor and semiconductor equipment industry returned, based on the average three-month rolling returns relative to the S&P 500 since January 1, 2001. Other industries also performed well over the same three-month period, including software & services, whose average returns are 3.06 standard deviations better than the average three-month rolling returns relative to the S&P 500 since January 1, 2001.
Conversely, some industries underperformed much more than usual. Bank stocks, for instance, fell than 24.99%, or a 2.54 standard deviation below what is normal relative to the S&P 500, while machinery stocks fell 16.8%, or 2.88 standard deviation below.
Perhaps the most important aspect of this analysis, however, is the fact that standard deviations of greater than two (plus or minus) tend to be good inflection points that have historically resulted in reversals of relative performance, whereby laggards like banks and machinery could end up being relative leaders in the future and current leaders like media and entertainment could become laggards.
Granted, this time around could be different, but rarely do market extremes remain market extremes for long and standard deviations have already begun to normalize in some instances this month, which has helped “broaden out” the market, a sign of relative health that many market participants will surely keep an eye on and would likely welcome.
Standard Deviation and Industry Forward Returns
| Industry | Three Month Return Relative to S&P 500 Index (as of May 31) | Standard Deviation (as of May 31) | Average Historical Return 12-Months after a +/-2 standard deviation |
|---|---|---|---|
Banks | -24.99 | -2.54 | 20.84 |
Machinery | -16.80 | -2.88 | 12.52 |
Semiconductors & Semiconductor Equipment | 23.49 | 2.87 | -18.26 |
Software and Services | 17.17 | 3.06 | -6.34 |
Source: AGF Investments using data from Factset as of May 31, 2023. Performance is calculated when respective industries out/underperform the S&P 500 Index by more/less than two standard deviations since the period beginning January 1, 2001. Past performance is not indicative of future results. One cannot invest directly in an index.
The views expressed in this blog are those of the author and do not necessarily represent the opinions of AGF, its subsidiaries or any of its affiliated companies, funds, or investment strategies.
Commentary and data sourced from Bloomberg, Reuters and company reports unless otherwise noted. The commentaries contained herein are provided as a general source of information based on information available as of June 19, 2023 and are not intended to be comprehensive investment advice applicable to the circumstances of the individual. Every effort has been made to ensure accuracy in these commentaries at the time of publication, however, accuracy cannot be guaranteed. Market conditions may change and AGF Investments accepts no responsibility for individual investment decisions arising from the use or reliance on the information contained here.
This document may contain forward-looking information that reflects our current expectations or forecasts of future events. Forward-looking information is inherently subject to, among other things, risks, uncertainties and assumptions that could cause actual results to differ materially from those expressed herein.
AGF Investments is a group of wholly owned subsidiaries of AGF Management Limited, a Canadian reporting issuer. The subsidiaries included in AGF Investments are AGF Investments Inc. (AGFI), AGF Investments America Inc. (AGFA), AGF Investments LLC (AGFUS) and AGF International Advisors Company Limited (AGFIA). AGFA and AGFUS are registered advisors in the U.S. AGFI is registered as a portfolio manager across Canadian securities commissions. AGFIA is regulated by the Central Bank of Ireland and registered with the Australian Securities & Investments Commission. The subsidiaries that form AGF Investments manage a variety of mandates comprised of equity, fixed income and balanced assets.
® The “AGF” logo is a registered trademark of AGF Management Limited and used under licence.
About AGF Management Limited
Founded in 1957, AGF Management Limited (AGF) is an independent and globally diverse asset management firm. Our companies deliver excellence in investing in the public and private markets through three business lines: AGF Investments, AGF Capital Partners and AGF Private Wealth.
AGF brings a disciplined approach, focused on incorporating sound, responsible and sustainable corporate practices. The firm’s collective investment expertise, driven by its fundamental, quantitative and private investing capabilities, extends globally to a wide range of clients, from financial advisors and their clients to high-net worth and institutional investors including pension plans, corporate plans, sovereign wealth funds, endowments and foundations.
Headquartered in Toronto, Canada, AGF has investment operations and client servicing teams on the ground in North America and Europe. AGF serves more than 800,000 investors. AGF trades on the Toronto Stock Exchange under the symbol AGF.B.
For further information, please visit AGF.com.
© 2025 AGF Management Limited. All rights reserved.


